

sargento03
-
Posts
56 -
Joined
-
Last visited
-
Days Won
2
Content Type
Profiles
Forums
Events
Posts posted by sargento03
-
-
It seems like over the past month work is being done throughout this site. Just wondering if that still the cleaning up of the site/road improvements described above, or if there is something else going on.
-
I couldn't find if there is a separate post that speaks of the new 600-unit apartments next to the Montrose whole foods (and maybe this one is it)...but my question is if anyone knows what is now being developed NEXT to the 600-apartments as that land too is being cleared... This section/development that I speak of is the northwest corner of West Dallas and Montrose.
-
Can someone confirm if this is true or a joke? This sign is now posted
 at the corner of Dowling Street and Holman Street in the Third Ward.
 -
^^ so are we getting a hotel?
When I met with them, they said they had over 100 interested developers at the initial RFQ event. They plan on narrowing that down to about 30 and then do a RFP. But given the initial interest they feel it is pretty certain they can get another 1000-room hotel at the north corner of the CC.
-
 2
2
-
-
I'm with HVS Consulting here im Houston and below is our 2012 update on the Houston hotel market.
http://www.hvs.com/article/5755/hvs-market-intelligence-report-houston-hotels-in-2012/
A firmly entrenched, expansive, and consistently viable oil and gas sector has earned Houston the moniker “Energy Capital of the World.” Houston is home to 22 companies on the 2011 FORTUNE 500 list (second only to New York City), and the vast majority are energy conglomerates, including ConocoPhillips, Marathon Oil, Halliburton, and many others (see list below). 1 Major corporations such as Chevron, ExxonMobil, and Shell, as well as oil service companies such as Schlumberger and Fluor, also have a presence in the area—in some cases, a larger presence than at their “home” locations. With oil above $75 per barrel for the entirety of 2011, these companies were able to resume high levels of hiring, training, and oil exploration. Oil prices have risen steadily in the first quarter of 2012; as of April 2nd, the price of West Texas Intermediate crude was approximately $105 per barrel. In addition to the energy industry, healthcare and shipping play a role in driving strong demand to area hotels.
Job Growth and Office Space Expansions
Houston’s workforce grew by 94,700 non-agricultural jobs between January of 2011 and January of 2012, a 3.75% increase from the prior year. 2 This growth placed the city first in the nation among metropolitan areas with a workforce of at least one million. The Greater Houston Partnership reported that Houston was the first metro area in the nation to surpass its pre-recession employment levels in the fall of 2011. As of January of 2012, the unemployment rate for the Houston metropolitan area stood at 7.6% (compared with 8.3% for the nation), and approximately 85,000 new jobs are forecast for 2012.
Houston’s office market is expanding to accommodate the surge in jobs. As of year-end 2011, the Houston office market offered 190.7 million square feet of commercial space. 3 Office vacancy rates in the city now stand at approximately 15%. Over one million additional square feet of office space is under construction throughout the city, primarily in the Galleria and West Houston submarkets. Absorption levels are expected to keep pace with those of 2011, potentially resulting in even lower vacancy rates for 2012.
New Convention District
Houston’s George R. Brown Convention Center, located Downtown, hosted 218 events in 2011, with a record-breaking attendance of more than 930,000 delegates. Earlier this year, officials released a master plan detailing a vision for a new convention district. The plan proposes three additional hotels within walking distance of the convention center, followed by an expansion of the existing facility. According to the master plan, Houston’s convention market needs another 2,000 hotel rooms to remain competitive with other convention destination cities such as New Orleans, San Antonio, and Denver. This plan is already moving forward; as of March 2012, Houston First Corporation, the entity responsible for managing the convention center and attracting development around it, officially began the search for a developer of a 1,000-room convention hotel through a Request for Qualifications (RFQ).
CONVENTION CENTER-AREA MASTER PLAN CONVENTION CENTER DISTRICT RENDERING
Hotel Submarkets in Houston
A variety of submarkets, each oriented toward the capture of select segments of lodging demand, encapsulate Greater Houston’s hotel industry. The most prominent of these submarkets are described in brief below:
Downtown/Central Business District: Houston’s Central Business District greatly benefits from the presence of companies in the energy sector; the more than 40 million square feet of office space in the CBD boasts the highest overall rental rate and lowest vacancy in Houston. The convention center, the Theater District, and sports and entertainment venues such as the Toyota Center and Minute Maid Park bring large amounts of meeting and leisure demand to hotels in the Downtown/CBD submarket. The 1.8 million square feet of commercial space added to Houston’s CBD in 2010/11 should greatly benefit area hotels as companies continue to move in.
Medical Center: 33.8 million gross square feet of patient care, education, and research space distributed across 162 buildings make the Texas Medical Center (TMC) the largest of its kind in the world, and the TMC continues to grow at a remarkable pace. Planned projects include new hospitals, clinics, research space, and other office space developed by TMC institutions and buttressed by city, county, state, and federal investments in infrastructure. The center’s projected growth to approximately 41 million gross square feet by 2014 would make this submarket a near match in terms of commercial square footage with Downtown.
Galleria: With nearly 32 million square feet of office space and the 7th largest mall in the nation, Houston’s Galleria district is one of the best-performing hotel submarkets in the city. The Galleria attracts national and international visitors, including many from Latin America. Hotels in this submarket achieve occupancy levels that typically exceed those of the city as a whole given strong, commercially driven weekday occupancy supported by healthy tourism levels on the weekend. Two new office buildings, totaling 682,000 square feet, are under construction in this submarket along the proposed Post Oak light rail line.
Houston Intercontinental Airport: The airport submarket has traditionally been one of the strongest in Houston, but significant supply increases before and during the recent recession negatively impacted existing hotels. Occupancy levels began recovering in 2011, but average rate growth in this submarket has lagged behind.
The Woodlands: Limited increases in hotel supply in this emerging office and medical submarket have kept hotel occupancies and rates strong. Just south of The Woodlands, ExxonMobil, a major demand generator for hotels throughout the city, continues with the construction of a three-million-square-foot home campus across 389 acres. It is uncertain at present whether the home campus will only consolidate Houston-area employees or also receive employees from ExxonMobil’s Fairfax, Virginia and Dallas, Texas operations.
Energy Corridor: Over the last five years, Houston’s Energy Corridor has been a premier office and hotel submarket, and growth has been evident within both sectors. Despite increases in supply, overall hotel occupancy has been healthy, and a lack of proposed supply should benefit existing hotels in 2012. Demand in this submarket could be affected by the relocation of ExxonMobil to its new facility near The Woodlands, but the impact may be lessened if current trends in office space absorption keep up.
Hotel Supply and Demand
Houston’s citywide hotel occupancy remained near or above 65% from 2005 through 2008 4, driven by hurricane-related demand, as well as several years of a booming economy. These strong levels drove average rate increases of approximately 25% (from nearly $80 to $100) during this same time frame, leading to the entrance of nearly 8,000 new hotel rooms in 2009/10 5. Unfortunately, fallout from the Great Recession, coupled with this tremendous increase in supply, brought occupancy and average rate down by 10% or more in 2009/10. Recovery became evident in late 2010, and hotels came through 2011 relatively healthy, with occupancy nearing 60% and rate between $90 and $92 6.
Year-to-date, the rate of growth has kept pace with performance in 2011. With only limited increases in supply expected in the near future, HVS forecasts the lodging market in Houston will recover to an occupancy level of 62%, with average rate growth of 5%, in 2012; as such, existing hotels (or new projects that have been able to obtain financing) are well positioned to benefit from the city’s economic recovery in the coming years.
Conclusion
The recent recession had a negative effect on Houston’s economy and lodging market, but both have come up strong. The latest performance trends show that Houston hotels are on an overall course of recovery, but performance is still far removed from the peaks achieved prior to the recession, suggesting Houston’s hotel industry still has room for growth. With so much job creation in the past two years, and the prospect of tens of thousands of new jobs; millions of square feet of commercial space; and the well-established healthcare, shipping, and energy sectors fueling future growth, Houston hotels seem to be on not only solid but fertile ground.
Since 2007, Luigi Major has completed over 50 consulting and valuation assignments for hotels in the Houston area and currently oversees hotel assignments in the region through our satellite office in Houston. The Houston office will host an upcoming HVS Regional Hotel Valuation Summit on April 26, 2012. To learn more and register for free, please visit www.hvs.com/events.
-
Maybe we should rename this post "Broadstone West Dallas"
-
I found a rendering, lets see if this works??
If not here's the link to the article with the rendering. http://www.multihousingnews.com/news/south/close-in-convenience-key-to-houston-development/1004044033.html
-
Hi, there are now TWO cleared sites at this corner and I'm wondering if anyone has additional info.
1. The first one that we all know about is the NE corner of W. Dallas and Gillete. This is the land owned by the city that is for sale (or sold? not sure), and stretches from West Dallas to San Felipe Park.
2. The second one is he NW corner of W. Dallas and Gillete. It used to be some sort of academy or school and I remember lots of "summer camps" here. This site was begun to be cleared about one to two weeks ago. Does anyone know what is going on here?
-
This sucks, I actually use this. For $4.5 each way it is an amazing deal. So for any visitor to this city, I guess the options are take a 2hour bus for $1.5, rent a car, or take a taxi.. The last two are a very expensive way to make it to the city.
-
Here is the article with 38 pictures of the store. Pretty cool!! Opening ceremonies at 730am on Wednesday.
http://www.houstonpress.com/slideshow/sneak-peek-at-whole-foods-montrose-33576832/
-
1
-
-
interesting. I wonder if it would be "on" Washington, or maybe just in the vicinity (like near the I-10 freeway)
-
1
-
-
that woman's house on o'neil is going to be in an interesting situation, a 4 story apartment building surrounding it on most sides, more people walking/driving around, more noise from the retail, and bye bye sun. However, i live in fourth ward and don't understand how that article says that some residents are upset of the o'neil/cushing road closures (north/south of webster/west grey). Those two roads are used by no one, well except the lady that lives in that house.
-
yes yes yes. this is great. So I think the location of this will be south of grey, north of webster, east of Matthews, and to the west of the existing post buildinds.
-
I hope they include a designated bike lane. Actually, there should be a rule that all new streets in the city should have a designated bike lane (not a sign to share the road that everyone ignores).
-
I think Metro buses are fine (quality-wise). I rode the bus for a year while in College and still do occasionally. I also did a short experiment of being w/out a car... that lasted two months. When I did my experiment I was quickly reminded of Metro's problem... frequencies. With the exception of a few lines, there can easily be a 30-45 min gap between buses and waiting that amount of time is no fun. I live in the Montrose area and I've easily walked across the neighborhood in 45min, and with a bike fuggedaboutit!
But I guess that's a chicken/egg problem.. We don't have higher frequencies because we don't have the ridership to support it/or we don't have the ridership because no one wants to wait 45min.
Will this change with higher gas prices?? I've definitely become more conscious, but I was reading somewhere that Metro's ridership was actually down in March despite higher gas prices.
On a similar note, I saw a ton of bikes around Montrose today, way higher than normal...maybe things are changing.
-
Is there any info as to the future of this site?
-
So is this really in the process of converting to a hotel? But if I read correctly no one knows exactly what brand/hotel it will be?
-
Good question regarding where the second phase will be built? Do they own more land, and where? because it doesn't appear anything else can be built next to the garage or the boy scout building. Maybe they'll fit a few apts north of the boy scout building, but additional parking too and retail?
Should this be moved to going up? Not sure what the rule is with that.
-
I heard today from the WF Kirby employees that the opening of the Montrose store is set for June 22nd. Some of them will be moving to the new store and I asked if they knew when it was opening and the guy said "June 22, it just got pushed back by two weeks."
-
1
-
-
There was an article about this on Culture Map:
-
whats up with all these car washes popping up in prime corners. One just popped up less than half a mile from this one on West Dallas and Taft.
-
1
-
-
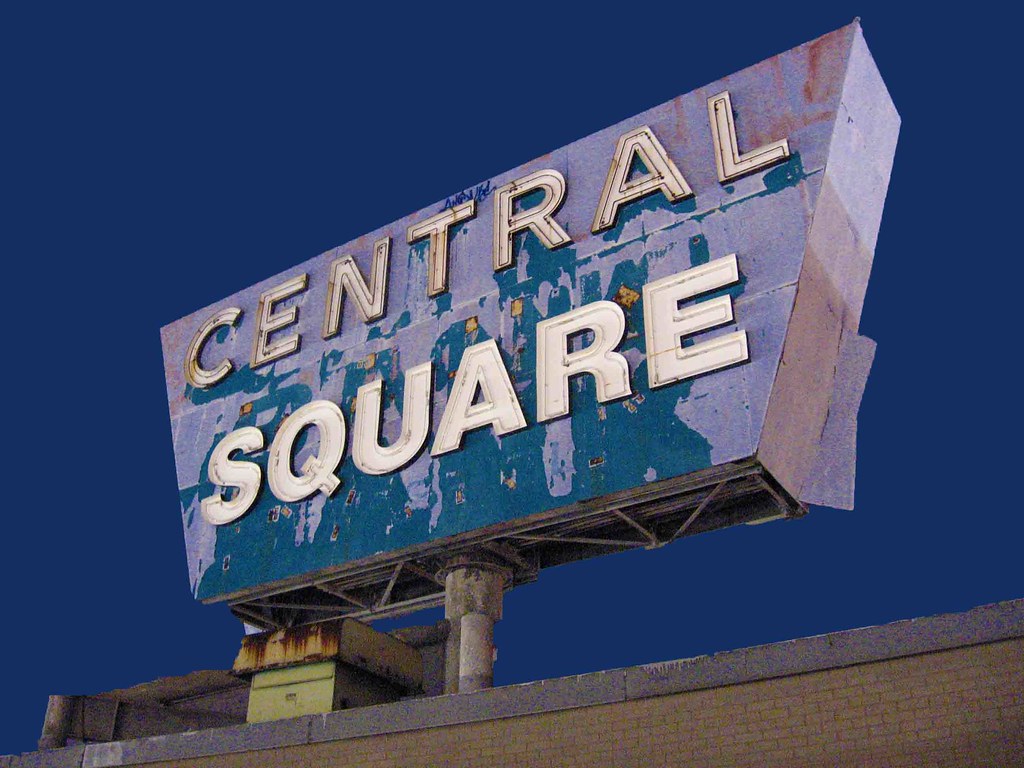
<div style="padding: 3px; text-align: left;"><a href="
title="photo sharing"><img alt="" src="http://farm3.static.flickr.com/2567/4019684078_3773310420.jpg" style="border: solid 2px #000000;" /></a><span style="font-size: 0.8em; margin-top: 0px;"><a href="
>The Central Square </a>, originally uploaded by <a href="http://www.flickr.com/people/secretsquirrel5468/">Secret5468</a>.</span></div>The paint continues to peel. Thanks, Secret.<div class="blogger-post-footer">
This photo is part of the HAIF photo pool on Flickr.
You are welcome to add your photos to the pool for the entire group to see.
Visit the pool: <a href="http://www.flickr.com/groups/haif/pool/">HAIF Houston Photo Pool on Flickr</a><img width='1' height='1' src='https://blogger.googleusercontent.com/tracker/7480774850351202792-5504080587780050903?l=haif-potd.blogspot.com' alt='' /></div>
great picture. i hope somebody does something useful w/ this building.
-
Does anyone have any info on what is being proposed at the SE corner of Montrose and West Dallas? There is a notice of variance sign up. More town homes?
As an aside, can someone please post a link so you can see what type of variance is being proposed at a particular property? I couldn't find anything like that online, but I assume it exists.
Many thanks.
I believe it is supposed to be "high-end" retail. There's been comments about it in some posts here, just don't remember where.
-
1
-
-
The typical transit agency provides service at a total cost per passenger mile.
According to its FY 2009 Annual Report, METRO's expenditures totaled $558,551,442 and it logged 610,865,178 passenger miles. That equates to a cost of $0.914 per passenger mile. For the sake of comparison, the IRS mileage rate for passenger vehicles in 2009 was $0.55 per mile driven; we can debate whether that figure works as a true proxy for the operating cost of a passenger vehicle, but to make the figures truly comparable, we'd first have to adjust for the average number of occupants per vehicle mile driven in a passenger vehicle. I don't think that there is any reasonable way to show that a car is less efficient than transit.
I think these figures are interesting nonetheless. It probably shows that at the moment, in houston, public transit is inefficient...and it is. It would be interesting to show a comparison of other cities with a higher transit usage to see if have a figure maybe even lower than $0.55 per mile. It would also be interesting to see how Metro's figure of $0.91 has changed over the years.
 at the corner of Dowling Street and Holman Street in the Third Ward.

Tinsley On The Park: Multifamily At 919 Gillette St.
in Montrose
Posted
Wow at $40 million land costs, they would need to build a massive project here to get a proper return on their land costs.